Friday, September 25, 2015

Human Development Index ; HDI


                                                      Comments due by Oct. 2, 2015
The HDI was created to emphasize that people and their capabilities should be the ultimate criteria for assessing the development of a country, not economic growth alone. The HDI can also be used to question national policy choices, asking how two countries with the same level of GNI per capita can end up with different human development outcomes. These contrasts can stimulate debate about government policy priorities.
The Human Development Index (HDI) is a summary measure of average achievement in key dimensions of human development: a long and healthy life, being knowledgeable and have a decent standard of living. The HDI is the geometric mean of normalized indices for each of the three dimensions.
The health dimension is assessed by life expectancy at birth component of the HDI is calculated using a minimum value of 20 years and maximum value of 85 years. The education component of the HDI is measured by mean of years of schooling for adults aged 25 years and expected years of schooling for children of school entering age. Mean years of schooling is estimated by UNESCO Institute for Statistics based on educational attainment data from censuses and surveys available in its database. Expected years of schooling estimates are based on enrolment by age at all levels of education. This indicator is produced by UNESCO Institute for Statistics. Expected years of schooling is capped at 18 years. The indicators are normalized using a minimum value of zero and maximum aspirational values of 15 and 18 years respectively. The two indices are combined into an education index using arithmetic mean.
The standard of living dimension is measured by gross national income per capita. The goalpost for minimum income is $100 (PPP) and the maximum is $75,000 (PPP). The minimum value for GNI per capita, set at $100, is justified by the considerable amount of unmeasured subsistence and nonmarket production in economies close to the minimum that is not captured in the official data. The HDI uses the logarithm of income, to reflect the diminishing importance of income with increasing GNI. The scores for the three HDI dimension indices are then aggregated into a composite index using geometric mean. Refer to Technical notes for more details.
The HDI does not reflect on inequalities, poverty, human security, empowerment, etc. The HDRO offers the other composite indices as broader proxy on some of the key issues of human development, inequality, gender disparity and human poverty.
A fuller picture of a country's level of human development requires analysis of other indicators and information presented in the statistical annex of the report.

Copy this link into your browser to look at the HDI data:
http://hdr.undp.org/en/content/table-1-human-development-index-and-its-components

Friday, September 18, 2015

Happiness Index

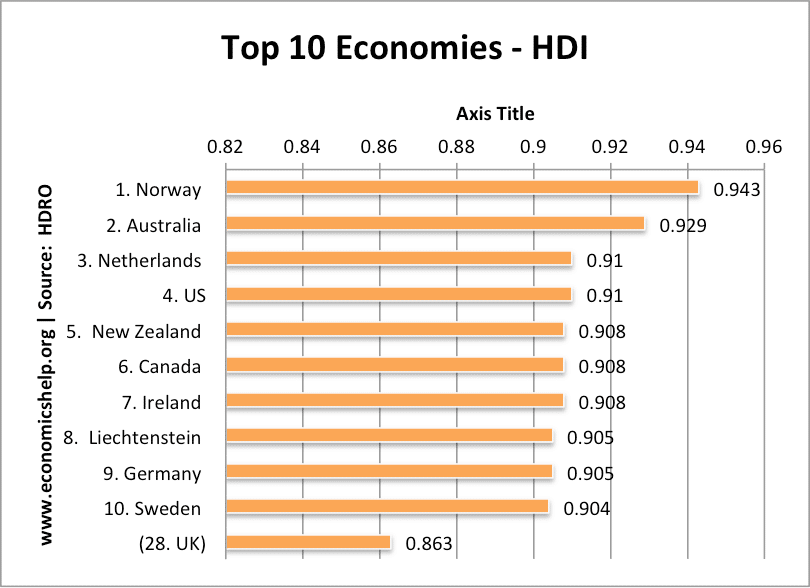
                                         Comments due by Sept. 25, 2015
We will start soon a detailed discussion of what is GDP, what are its components and how is it calculated. We will also point out to the fact that the GDP was not meant to be a measure of welfare as some insist on doing. Efforts to develop a Happiness Index as a measure of "subjective wellbeing" is something that you must become familiar with. I hope that some might even decide to write your research paper on this topic or something closely related to it.
***************************************************************************************************
Calls from UK Prime Minister David Cameron, the United Nations’ World Happiness Report, the OECD’s Better Life Index, along with psychologists and economists, all reflect on the need to develop a better understanding of subjective wellbeing (‘happiness’). Though many contemporary economies have tracked crime, education and economic production for the best part of a century, subjective wellbeing only began to become a staple of world economic indicators in the 1970s.
Unlike national income accounting, which initiated the collection of GDP in the 1930s, subjective wellbeing is a rather young indicator. Though there have been successful projects to roll back GDP (e.g. Bolt and van Zanden 2014, Broadberry 2015), attempts to construct historical series for wellbeing have been notably lacking. Without such a series, we are left wondering how wellbeing responds to key historical events, such as expansionary monetary policies, education and longevity.
But if constructing historical series for wellbeing makes sense, how can we extend existing measures when direct survey evidence was only initiated in the 1970s? The key insight in our new research paper (Hills et al. 2015) is that language conveys sentiment, and that the growing availability of digitised text provides unprecedented resources to construct a quantitative history of wellbeing based on historical language use.
In particular, the foundation of our work involves combining multiple large collections of texts of natural language going back two centuries with state-of-the-art methods for deriving public mood (i.e. sentiment) from language. The recent digitisation of books, newspapers and other sources of natural language – such as the Google Books Ngram database – represent historically unprecedented amounts of data (‘big data’) on what people thought and wrote over the past few centuries (see Michel 2011). These databases have already proved fruitful in detecting large-scale changes in language, which in turn correlate with social and demographic change, for instance in Hills and Adelman (2015).
These data offer the capacity to infer public mood using sentiment analysisDeriving sentiment from large collections of written text represents a growing scientific endeavour. Examples include recovering large-scale opinions about political candidates, predicting stock market trends, understanding diurnal and seasonal mood variation, detecting the social spread of collective emotions, and understanding the impact of events with the potential for large-scale social impact such as celebrity deaths, earthquakes and economic bailouts (e.g. Pang and Lee 2008). Applying the same methods to historical text we can begin to produce more quantitative accounts of national happiness.
In the approach we take, sentiment measures are based on valence norms for thousands of words. These already exist in the literature and are collected from a large group of individuals who are asked to rate a list of words on how those words make them feel (e.g. Gilbert 2007). In the present case, valence norms based on the affective norms for English words have already been collected for five languages: English, French, Spanish, Italian, and German.
We applied these norms to the Google Books corpus for each of these languages, allowing us to derive a new index for subjective wellbeing going back to 1776, which we tentatively call the HPS index. An initial comparison with subjective wellbeing collected with survey data is shown in Figure 1. The data reflect the residuals after controlling for country fixed effects and clearly show a strong and significant correlation with our measure based on historical language.
Figure 1. Comparison between survey measures of life satisfaction and residuals (after controlling for country fixed effects) for our measure based on sentiment from historical text.
Note: The grey area represents the 95% confidence interval.
Rolling the text-derived measures of subjective wellbeing back to 1776 reveals a quantitative picture of how public sentiment has changed across the six countries we considered: France, Germany, Italy, Spain, the UK and the US. Though we make clear in our research that we need to exercise caution when examining very long-run trends (as language itself has evolved so much), it is nonetheless clear in Figure 2 that short-term events, such as the exuberance of the 1920s, the Depression era, and World Wars I and II show clear and distinguishable influences on subjective wellbeing.
Figure 2. The average valences over the period 1776-2000.
Note: For all countries the vertical red lines correspond to 1789 (the year of the French Revolution), World War I (1915-18) and World War II (1938-45). In the five European countries, a line is draw for 1848 (the year of the revolutions). In the US, the vertical lines represent: the Civil War (1861-65), the Wall Street Crash (1929), the end of Korean War (1953) and the fall of Saigon (1975); in the UK, the Napoleonic Wars (1803-15). In Spain, the starting of Civil War (1936); in France, the Napoleonic Wars (1803-15), the end of the Franco-Prussian War (1870); for Germany, the vertical lines represent the Napoleonic Wars (1803-15), the Franco-Prussian War and unification (1870), Hitler's ascendency to power (1934), the reunification (1990); for Italy, the unification (1861-70).

Why is a quantitative history of wellbeing important?

The fledgling state of wellbeing data has limited our collective ability to understand how wellbeing responds to different historical events. This has in turn limited the use of wellbeing in public policy, health initiatives and financial decision-making. In practice, if subjective wellbeing is to become a key factor in guiding our collective behaviour, then we need accounts of wellbeing on a par with those of GDP.
Using wellbeing as a measure to guide behaviour, however, takes more than the desire to simply improve wellbeing. As noted by Gilbert (2007), people have problems understanding so-called ‘affective forecasting’ – the ability to understand how one will feel in the future – and with this also comes a limited capacity to understand how prior events and decisions influenced our past happiness.
To overcome this, especially at the government level, we must develop our capacity to predict how wellbeing responds to both deliberate and unexpected events. Better predicting economic fortunes was the motivation of the national income accounting, which later became GDP, following the Depression in the 1930s. Of course, now numerous decisions are based on GDP, despite a near global acceptance that, in the words of John F Kennedy, “it measures everything in short, except that which makes life worthwhile” (Presidential Library and Museum, North Dakota).
Thus, as with GDP, governments and other agencies recognise the importance of this additional ‘emotional accounting’ and, by all accounts, they want to understand how better to use it to improve future wellbeing. But to do that we need historical informed accounts of what this means, and our index represents a first attempt.(Vox, Sept 17, 2015)

Friday, September 11, 2015

Wage Rates and Interest Rate

 
                                                       Comments due by Sept. 18, 2015
 
For most Americans, paychecks determine living standards. Unfortunately, wages in America have long stagnated or declined for most working people, including college graduates.
The disappointing employment report for August — in which wage growth showed no sign of accelerating — only drove home that reality.
Worse, flat or falling pay is self-reinforcing because it dampens demand and, by extension, economic growth. In the current recovery, median wages have fallen by 3 percent, after adjusting for inflation, while annual economic growth has peaked at around 2.5 percent. At that pace, growth isn’t able to fully repair the damage from the recession that preceded the recovery. The result is a continuation of the pre-recession dynamic where income flows to the top of the economic ladder, while languishing for everyone else.
Policy makers should be focused on strategies to raise wages, but the opposite appears to be happening. Just as Congress enfeebled the economy by switching too soon from stimulus spending to budget cuts, Federal Reserve officials have all but vowed to begin raising interest rates this year. That move reflects a belief that the economy is returning to “normal,” but it would be premature, because today’s norm is an economy that is incapable of generating and sustaining broad prosperity.
In a healthy economy with upward mobility and a thriving middle class, hourly compensation (wages plus benefits) rises in line with labor productivity. But for the vast majority of workers, pay increases have lagged behind productivity in recent decades. Since the early 1970s, median pay has risen by only 8.7 percent, after adjusting for inflation, while productivity has grown by 72 percent. Since 2000, the gap has become even bigger, with pay up only 1.8 percent, despite productivity growth of 22 percent.
Why has worker pay withered? The answer, in large part, is that rising productivity has increasingly boosted corporate profits, executive compensation and shareholder returns rather than worker pay. Chief executives, for example, now make about 300 times more than typical workers, compared with 30 times more in 1980, according to the Economic Policy Institute. Other research shows far greater discrepancies at some companies.
For younger people, pay has actually declined. The average hourly wage for recent college graduates in early 2015 was $17.94, compared with $18.41 in 2000. That “loss” in starting pay, about $1,000, can carry over to diminished earnings for years to come. Young high school graduates have it even worse. Their average hourly pay was $10.40 in early 2015 versus $11.01 in 2000.
The Fed is a crucial player in reversing those trends, since one of its mandates is to foster full employment. Wage stagnation is a clear sign that the economy is not at full employment, which means it needs loose monetary policy, not tightening. An interest rate hike, by sending the wrong signal of economic health, could make it harder for labor groups and policy makers to assert the urgency of their efforts to raise pay.
In the past year, low-wage workers have successfully fought for minimum wage increases in states and cities. Congressional Democrats have championed legislation to raise the federal minimum wage and to fight wage theft and abusive worker scheduling. The Labor Department is moving ahead with a much needed new rule to update the nation’s overtime-pay laws.
In the midst of those efforts, it would be a setback for the Fed to act as if the economy is already near full employment. It’s not. The proof is in the paycheck.(NYT Editorial 9/7/2015)

Thursday, September 03, 2015

Jobs in New Orleans 10 years after Katrina


                         Comments due by Sept.11, 2015
New Orleans has spent the past decade clawing its way back to normality after Hurricane Katrina decimated much of the city, causing residents and businesses to flee. But as of late, it’s struggling to hold onto jobs.
It was the only major metropolitan area to have lost jobs in July compared with a year earlier, the Labor Department said Tuesday. In the past year, 50 out of the 51 metropolitan areas with populations of one million or more saw a rise in employment, according to the Labor Department. But payrolls shrank by 3,800 in the New Orleans-Metairie area in July, with losses concentrated in construction and the manufacturing sector that includes oil refining.
The New Orleans-Metairie area steadily added jobs year over year from fall 2010 through February this year. Since March, the area has lost an average of 2,275 jobs each month compared with the prior year.
Meanwhile, with the overall national economic recovery, quality is uneven among the thousands of jobs that have come back since the hurricane. A recent in-depth analysis showed that many of the jobs created in New Orleans since the devastating hurricane are low-wage jobs in the hospitality industry, mainly in the city’s restaurants, for which it is renowned.
The area’s nonseasonally adjusted unemployment rate fell to 6.4% in July from 6.7% in June, but is still well above the nonseasonally adjusted national average of 5.6% in July. The seasonally adjusted national unemployment rate was 5.3% in July.
In the past three years, its monthly unemployment readings have swung between 7.9% and as little as 5%. So far in 2015, the unemployment rate has hovered between 6% and 6.9%.
Across the country, winners over the past year included the New York-Newark-Jersey City metropolitan area, which added 164,400 nonfarm jobs between July 2014 and July 2015. Los Angeles-Long Beach-Anaheim, in California, saw 157,500 jobs spring up in the past year. Dallas-Fort Worth-Arlington, Texas, continued to add jobs to the tune of 121,700, even as the energy industry took a hit from falling gas prices.
Overall, 322 out of 387 metropolitan areas added jobs in the past year. Eleven were unchanged, and 54 lost jobs. (WSJ)